New Software Stock Market Tools SMT1:

discover the power of AI Stock Market forecast and trading simulation
- increase your trading profitability
Showing posts with label SP-500 index. Show all posts

2012-04-04

SP-500 Index Cycle Analysis Forecast for Spring and Summer of 2012

There is a simple predictive model that is built on an assumption that the stock market has a semi-cyclical nature. Many technical analysts use cycle analysis in their comprehensive research. The cycles may not be stable all the time but the probability of repeating patterns can be big enough to get a consistent trading profit.

Cycle analysis can be made using charts. However, the distinctive cycles in pattern can be masked by more powerful factors (fundamental data, bad/good news, global events, etc.) that over-drive the market time-from-time. Therefore, a special software can be very useful for extracting hidden cycles.

The chart below shows S&P-500 index forecast for April-May and summer months of 2012. The calculation has been performed using Stock Market Predictor SMAP-3. According to this forecast the stock market might continue its uptrend until the end of May, then have some correction in June and top in July.

2011-06-10

June 2011: SP-500 Might Not Touch 1250, At Least For Now

One of the popular ideas now is that until S&P-500 index touch 1250 number, it is too early to buy or sell. However, on the assumption that currently many market participants are looking at charts and use technical analysis to make their buy-sell decisions, the index might not move down too much, at least for now.

If almost everyone is considering that it is not good time yet to sell (or go short) and waiting for this magic number, this move might not happen. The reason is that there will be no sellers but mostly holders that are waiting. It can be a typical situation when an expectation affects the market. The index might stall for a while and then move up. Also a statistical cycle analysis method based on action-reaction idea indicate that such reverse will happen after June 15-17 and before reaching 1250 value:

Chart has been calculated using cycles predictor

2010-12-31

2010 Stock Market Strength Might Propagate Into 2011

S&P-500 index has grown 12.78% during 2010 and it is ending on a positive note. The US corporate profits continue improving and companies have a lot of cash that provide opportunities for business optimization, better dividends, and make stocks more attractive. Also during the last several months the stock market became more predictable from the technical analysis point of view.

Many experts believe that the corporate earnings will grow further in 2011. Evidently, the prices of most shares will move in a natural cyclical manner with dynamical responds to unexpected news, as it was before. In average, major indexes are expected to perform around the same as in 2010. Anything can happen but, as always, extremes have less probability than averages.

Wishing You
Happy 20111 New Year!

Hopefully, 2011 will be a better year with many new opportunities for stock investors and traders!

2010-10-30

SP-500 Index: the First Two Weeks of November 2010

Although technically there are no many signals for significant advance in any direction, a possible scenario could be a downside move at the end of the first week and then a slight bounce back. As example of technical prediction, see the chart. The chart has been plotted using InvAn-4 pattern recognition forecast for S&P-500 index prices (November 1-12, 2010).

From the summarized point of view, stock market investors may not rely on technical predictions but rather react to the US congressional elections and the Federal Reserve economic stimulus plans. Therefore, news might be a major driving force in the stock market for the first two weeks of November 2010.

2010-09-12

Pattern Prediction for September 13-24, 2010

The patterns of the S&P-500 Index may be repeatable in the future. Pattern recognition systems can help to find similar patterns easier by classifying them. After selecting similar patterns, it is possible to use them to predict the future pattern.

Investment Analyzer (IA) by Addaptron Software has a few extra features for a short term forecast. To predict prices of the selected stock (index) using pattern similarity. IA searches for the pattern from the internal database by scanning all historical data. Depending on degree of similarity, it ranks all possible matches within given historical period and then combine them.

The chart below has been plotted using IA pattern similarity feature. S&P-500 index prices have been used as input; the output is prediction for September 13-24. A possible prediction is a slight uptrend and then more downtrend. However, technical prediction may be different if something fundamental happens.


Nothing in this piece or blog should be construed as investment advice in any way. Always do our own research or/and consult a qualified investment advisor. It is wise to analyze data from multiple sources and draw your own conclusions based on the soundest principles. Be aware of the risks involved in stock investments

2010-08-09

S&P-500 Index May Drop Soon

There are several negative fundamental factors that can cause stock market downtrend: GDP growth slowed to 2.4% in the second quarter compared with 3.7% in the first quarter; jobless rate is at high level (9.5%); individuals and companies save cash at near record levels; consumer spending shows no signs of picking up; state budget deficit poses an additional risk to the US economy.

Despite a weak current conditions of the US economy and pessimistic investors' expectations, the stock market would continue to move sideways above some supportive level. However, technically S&P-500 Index is ready to start a downtrend cycle. The probability may increase with approaching September-October traditional low performance season.

Additionally, there is a natural stock market fluctuation. The following chart represents S&P-500 forecast for September 2010 using cycle analysis. The calculation has been performed using SMAP-3 computer program:


A possible prediction is a cycle with minimum in September. However, as always - technical prediction may be different if something fundamental happens.

Nothing in this piece or blog should be construed as investment advice in any way. Always do your own research or/and consult a qualified investment advisor. It is wise to analyze data from multiple sources and draw your own conclusions based on the soundest principles. Be aware of the risks involved in stock investments


2010-06-09

One-day Stock Market Performance Can Be an Indicator

According to Efficient Markets approach, news and other publicly available information are incorporated into the price of a stock. One of the available news factors is a state of the stock market itself - bullish, bearish, or neutral. The state can be the same or it can evolve. A state change results the re-evaluation of price with a certain time delay. So any stock market movement causes a certain reaction of investors. If the market suddenly plunges, investors may start panicking, selling, and dragging the market even faster. If stock market prices are increasing without fluctuations for long, investors become confident to invest. As a result, if more money inflows, demand pushes prices up.

In the same way, one-day stock market performance can impact the emotions of investors. Therefore, it can be considered as a kind of indicator. The chart below shows how a big one-day positive performance can push the market up (callout 1..5):


The chart represents the curve of S&P-500 index values for period from October 2008 to April 2009 (blue line) and the curve of one-day performance (red line). The performance calculated using formula:


P1 = 100% * (C2 - C1) / C1


where C2 - current day closing price, C1 - previous day closing price.

© Alex Shmatov. Published with permission of the copyright owner. Further reproduction strictly prohibited without permission.


2010-04-23

Contributing Factors in Forecasting: Stocks vs. Stock Market and Sectors

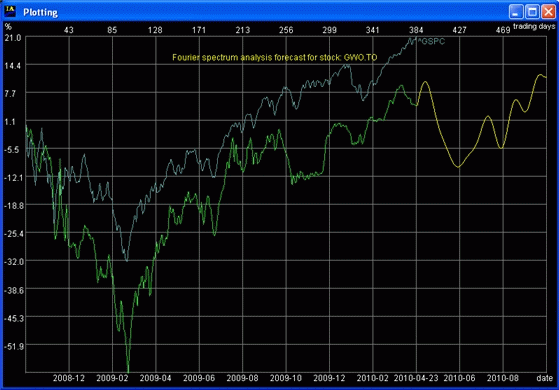
Each company belongs to a particular industry, sector, national stock market, as well as, global stock market. If system conditions change, company and its stocks respond to this changes. Indeed, a general stock market exerts a significant influence on the behavior of an individual company stocks. That is why experienced investors always carefully watch the stock market, sectors, and industries conditions.

On the other hand, a company is a part of subsystems and global system. It means each company performance is a contributing factor in a whole system performance. So that we could analyze a single company and try to predict the behavior of the stock market. However, it is only partially possible. As example, the recent financial crisis caused by a system failure showed that system itself may have a significantly bigger risk-factor.

Since all structure and all levels of sub-structures depend mutually, it would be unwise to ignore either predictions of big, medium, or small parts or a whole system. Evidently it is possible to build a more accurate forecast by combining predictions for system, sub-systems, and elements of sub-system.

As example, let's consider a three-month forecast for stock market (515 stocks from different sectors):


stocks from different sectors:


and individual company stocks from a leading sector:


In conclusion, we could assume that there is a certain probability that the stock market will have a correction (downtrend around 8-12%) after May 6.


The charts have been calculated and plotted by Investment Analyzer Inv-An-4.


Nothing in this piece or in this blog should be construed as investment advice in any way. Always do your own research or/and consult a qualified investment advisor. It is wise to analyze data from multiple sources and draw your own conclusions based on the soundest principles. Be aware of the risks involved in stock investments.


© Alex Shmatov. Published with permission of the copyright owner. Further reproduction strictly prohibited without permission.


2010-04-17

Predicting Stock Market Using Expert Method

The more methods and information are taken into consideration, the more precise an investment-related solution and, consequently, the more profitable is investing. One of the forecasting methods that uses a collective wisdom is an expert method. This method can be explained by following. As example, an experimentalist shows a pen and asks about 40 people to write down their estimate of the length. Then he collects notes and calculates the average number - normally it is almost 100% accurate. Why it works? Everyone makes errors in different directions so that averaging gives a precise result.

An example of simplified expert method forecast in stock forecasting can be analysts' opinions that collected and averaged. Such information can be found, for instance, on Yahoo Finance webpage "Analyst Opinion" for each stock, it is called "Recommendation Summary". If mean recommendation is equal or close to 1, experts predict strong performance because "1" means "strong buy". If mean recommendation is equal or close to 5, experts predict stock decline because "5" means "sell". It is natural to assume that the more experts express their opinions, the better should be the result of prediction.

Another example of expert forecast could be using your own research of different factors that can contribute certain "opinions" in composed forecast. You can assign different weight for each factor and build an estimation based on weighted averaging. For instance, fundamental analysis may be one the most influential factors, then news factor, technical analysis prediction factor, seasonal price fluctuation factor, etc. All these factors should be added with different weight coefficients. Then the result should be divided by total amount of all weights.

One more idea is to read different current news, analytical articles, blogs, investor forums and draw a summarized conclusion from all opinions, positive and negative predictions. To make this process more automatic, it can be possible to participate on-line polls. There are some websites where you can participate in building a collective forecast for S&P-500 index. You can share your opinion by voting and see the result of composite forecast. If you use more than one method, approach, or tool for prediction, it could be reasonable to give a vote for each one. All participants may benefit from building a simple average forecast. However, do not put too much trust in any method alone - make your own conclusion.

Link to: useful resources


© Alex Shmatov. Published with permission of the copyright owner. Further reproduction strictly prohibited without permission.


2010-02-13

Stock Market Forecast Using Expert Method


The more methods and information are taken into consideration, the more precise an investment-related solution and, consequently, the more profitable is investing. There is Expert Method. This method can be explained by following. As example, an experimentalist shows a pen and asks about 40 people to write down their estimate of the length. Then he collects notes and calculates the average number - normally it is almost 100% accurate. Why it works? Everyone makes errors in different directions so that averaging gives a precise result.


There is a webpage where you are invited to build a collective forecast for S&P-500 index. Please share your opinion by voting and see the result of composite forecast. If you use more than one method, approach, or tool for prediction, it could be reasonable to give a vote for each one. All participants may benefit from building a simple average forecast. However, do not put too much trust in any method alone - make your own conclusion.


Link to S&P-500 index weekly forecast


© Alex Shmatov. Published with permission of the copyright owner. Further reproduction strictly prohibited without permission.