After a few years of struggle to find an alternative to over-leveraged financial models, the transition to a new era of a deleveraged economy has begun. Recently, the necessity of this transition is confirmed by rising European and Global financial uncertainties. Evidently, these are negative factors that still keep investing risk at higher than normal level. On the other hand, there are positive signs of recovery.
The third quarter US GDP almost doubled to 2.5%. The unemployment rate has improved from 9.1% to 9.0% in September. These two numbers cause some debates concerning how they are calculated and if they are able actually to reflect the reality of economics, however, other numbers also look good. The most important numbers that push the shares prices are corporate earnings. They are relatively healthy. Therefore, the possibility of a double recession now seem less likely than before.
Furthermore, S&P-500 is trading below historical price-earning ratio. Many stocks look cheap and attractive. Since most investors are still scared by the market volatility of the recent years, they keep a lot of cash and potentially able to lift the demand and prices. If the future outlook of the stock market stays strong, further uptrend can be just a matter of time.
Showing posts with label investors. Show all posts
Showing posts with label investors. Show all posts

2011-10-05
October: Is It Time for Bull?
Lately, the economists re-evaluated their previous estimates and significantly lowered the predictions for the US economic growth this year and in 2012. This fundamental equilibrium reset, as one-time event, coincidentally has combined with a cyclical September-October low market season. A high volatility, remaining macroeconomic risks, and crowd fears persist. A lot of confusions still dominate the stock market. What is next to expect?
Europe troubles might continue to affect the global markets. The unemployment rate and housing market might not improve quickly. However, the US corporate reported earnings continue to exceed the profitability estimates in most cases. A lot of stocks are now cheaper than during the 2008-2009 market calamity. The future expectation is the thing that drives the market, not the past performance. That is why many investors and traders hope for rallies.
Europe troubles might continue to affect the global markets. The unemployment rate and housing market might not improve quickly. However, the US corporate reported earnings continue to exceed the profitability estimates in most cases. A lot of stocks are now cheaper than during the 2008-2009 market calamity. The future expectation is the thing that drives the market, not the past performance. That is why many investors and traders hope for rallies.
2011-08-17
Crashes Always Come Unexpectedly
What did exactly cause the recent sell-off ? There are different opinions among experts - debt-ceiling standoff, US credit rating downgrade, disappointing economic growth statistics, Europe troubles, or all combined together. As usually, it happened suddenly and quickly. There might be at least two ideas why recent declines happen faster and faster. The first one is that investors reaction to uncertainty and tolerance for risk have changed; it takes less and less to scare investors.
The second reason is a fast electronic trading. It allows programmed computers to sell under particular circumstances in milliseconds that develops a temporal disconnection between the actual factors and reasonable market prices - the market overreacts and makes irrational movements before reaching an after-crash equilibrium. As a matter of fact, the latest huge swings with changing directions every day have never been seen before in S&P-500 history.
In new era of globalization, mutual dependencies, and markets interconnection, the system crises turned out to be a new threat to our global well-being. Nonetheless, it seems the investors' expectation now has changed - the US and global economic growth is likely to be less healthy in the near future than previously estimated.
Some resources: Trading Strategies for a Stock Market Crash,
How to Escape from a Bear
The second reason is a fast electronic trading. It allows programmed computers to sell under particular circumstances in milliseconds that develops a temporal disconnection between the actual factors and reasonable market prices - the market overreacts and makes irrational movements before reaching an after-crash equilibrium. As a matter of fact, the latest huge swings with changing directions every day have never been seen before in S&P-500 history.
In new era of globalization, mutual dependencies, and markets interconnection, the system crises turned out to be a new threat to our global well-being. Nonetheless, it seems the investors' expectation now has changed - the US and global economic growth is likely to be less healthy in the near future than previously estimated.
Some resources: Trading Strategies for a Stock Market Crash,
How to Escape from a Bear
2011-03-15
The Chain of Unfortunate Events Struck the Stock Market
The first hit on a weak global economy recovery was the re-appearing of European debt problems. Then as it turned out after revised estimate of the fourth quarter, the US economy grew 2.8% instead of 2.9% during 2010. Next, the uprisings in the Middle East induced oil prices to surge. A soaring oil price caused the fear of inflation. The market reaction to oil price overshadowed the good news of US improving labor market.
China normally has a trade surplus with the world but this time it reported a significant trade deficit for February. Higher prices for oil and other commodities increased its imports and decreased exports, raising concerns about Chinese inflation and growth. All above was enough to scare the bull but even more was set to come.
The natural disaster in Japan added a big portion of negativity to the stock market. Now investors are so concerned by a fragile global economy. Disrupting global supply and the estimates of an infrastructure damage show that the losses are disturbing. Evidently, this disaster is going to bring huge economical consequences to a global economy.
Worries might continue to dominate the market for a while. However, no matter what happens, fear always exceeds a possible realistic impact of any event. Hopefully, Japan's catastrophe will be the last one in the series of bad events of this year. To a natural law of harmonic balance, April, as a corporate reporting month, might bring some good news to the stock market. By the way, US job market is gradually healing - the unemployment rate is the lowest since April 2009.
China normally has a trade surplus with the world but this time it reported a significant trade deficit for February. Higher prices for oil and other commodities increased its imports and decreased exports, raising concerns about Chinese inflation and growth. All above was enough to scare the bull but even more was set to come.
The natural disaster in Japan added a big portion of negativity to the stock market. Now investors are so concerned by a fragile global economy. Disrupting global supply and the estimates of an infrastructure damage show that the losses are disturbing. Evidently, this disaster is going to bring huge economical consequences to a global economy.
Worries might continue to dominate the market for a while. However, no matter what happens, fear always exceeds a possible realistic impact of any event. Hopefully, Japan's catastrophe will be the last one in the series of bad events of this year. To a natural law of harmonic balance, April, as a corporate reporting month, might bring some good news to the stock market. By the way, US job market is gradually healing - the unemployment rate is the lowest since April 2009.
2010-10-30
SP-500 Index: the First Two Weeks of November 2010
 Although technically there are no many signals for significant advance in any direction, a possible scenario could be a downside move at the end of the first week and then a slight bounce back. As example of technical prediction, see the chart. The chart has been plotted using InvAn-4 pattern recognition forecast for S&P-500 index prices (November 1-12, 2010).
 From the summarized point of view, stock market investors may not rely on technical predictions but rather react to the US congressional elections and the Federal Reserve economic stimulus plans. Therefore, news might be a major driving force in the stock market for the first two weeks of November 2010.
2010-10-09
October 2010 Stock Market Overview: Fundamentals Not Improving, Technicals Not Worsening
Due to a growing expectation that the US Federal Reserve will ease a credit environment to help the economy recovery, the US dollar dropped to several-month lows against most foreign currencies. More dollars may stimulate the economical growth. On the other hand, if the Federal Reserve pumps more dollars into the economy, a falling dollar can negatively affect consumers, businesses, and investors.
A dollar weakness together with the news that the US federal deficit for the 2010 budget year was estimated around $1.3 trillion add some fear of the instability of the system, Gold hit a new high that may also evidence a weak hope among investors for a decent stock market performance.
The US unemployment stayed at high 9.6% rate for the last couple of months. Adding jobless people who are not actively seeking work and people who are underemployed result more than 17%. Such statistics may indicate that the stimulus measures failed to create jobs as it was initially expected.
Some of technical indicators signal a lasting momentum that may keep the recent uptrend cycle for several weeks ahead. However, the third quarter earnings reports may not be so optimistic to sustain an existing stock market evaluation. In this case, major stock market indexes may have a correction if more negative news add the pressure.

The chart above shows S&P-500 forecast for the period from October 11 to October 22, 2010. The calculation has been performed using Neural Network Stock Trend Predictor NNSTP-2. The forecast is a slight uptrend.
A dollar weakness together with the news that the US federal deficit for the 2010 budget year was estimated around $1.3 trillion add some fear of the instability of the system, Gold hit a new high that may also evidence a weak hope among investors for a decent stock market performance.
The US unemployment stayed at high 9.6% rate for the last couple of months. Adding jobless people who are not actively seeking work and people who are underemployed result more than 17%. Such statistics may indicate that the stimulus measures failed to create jobs as it was initially expected.
Some of technical indicators signal a lasting momentum that may keep the recent uptrend cycle for several weeks ahead. However, the third quarter earnings reports may not be so optimistic to sustain an existing stock market evaluation. In this case, major stock market indexes may have a correction if more negative news add the pressure.

The chart above shows S&P-500 forecast for the period from October 11 to October 22, 2010. The calculation has been performed using Neural Network Stock Trend Predictor NNSTP-2. The forecast is a slight uptrend.
2010-06-27
Multi-input Improvement of One-day Performance Indicator
Stock market forecast can be built using different technical indicators. The relative change between the closing prices of two consequent days can be called one-day performance indicator (ODP indicator). The interpretation of ODP indicator chart is very simple - an uptrend starts after a big positive value of ODP indicator (the chart has been presented in the recent post). It works by a simple scheme: input1 → output.
However, a closer look at ODP indicator chart reveals also a typical pattern before starting uptrend - it fluctuates while moving down and then it has a big positive value. So that the more informative scheme would be in case of using n days of ODP indicator signals: (input1, input2, . . inputn) → output. It reminds candlesticks pattern chart. A candlestick figure consists of Real Body and Upper and Lower Shadows. The Real Body size is proportional to the difference between opening and closing prices of one day. Since it is no a big difference between closing prices of previous day and opening price of the next day, there is a similarity between Real Body and ODP indicator.

Considering this uptrend case, it is important to notice that there could be many other ODP indicator patterns. Investors could analyze these multi-day patterns on charts (in the same way as candlesticks pattern is used as a tool to predict future prices) or by using an automatic statistical method to map the correlation (input1, input2, . . inputn) → output. Evidently, one of the simple and powerful statistical methods that could be used for this purpose is Neural Network.
© Alex Shmatov. Published with permission of the copyright owner. Further reproduction strictly prohibited without permission.
However, a closer look at ODP indicator chart reveals also a typical pattern before starting uptrend - it fluctuates while moving down and then it has a big positive value. So that the more informative scheme would be in case of using n days of ODP indicator signals: (input1, input2, . . inputn) → output. It reminds candlesticks pattern chart. A candlestick figure consists of Real Body and Upper and Lower Shadows. The Real Body size is proportional to the difference between opening and closing prices of one day. Since it is no a big difference between closing prices of previous day and opening price of the next day, there is a similarity between Real Body and ODP indicator.
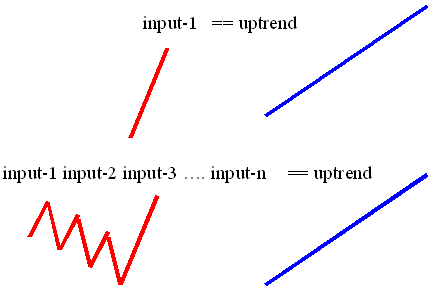
Considering this uptrend case, it is important to notice that there could be many other ODP indicator patterns. Investors could analyze these multi-day patterns on charts (in the same way as candlesticks pattern is used as a tool to predict future prices) or by using an automatic statistical method to map the correlation (input1, input2, . . inputn) → output. Evidently, one of the simple and powerful statistical methods that could be used for this purpose is Neural Network.
© Alex Shmatov. Published with permission of the copyright owner. Further reproduction strictly prohibited without permission.
2010-05-19
Predicting Stock Market Using Cycle Analysis
Many investors could benefit from a fluctuating nature of the stock market. A semi-cyclical nature of the market is a bad surprise for some investors but others know how to take advantage of the cycles.
One of the market characters is that it has powerful and pretty consistent cycles. Its performance curve can be considered as a sum of the cyclical functions with different periods and amplitudes. Some cycles known by investors for long, for example, four-year presidential cycle or annual and quarterly fiscal reporting cycles. By identifying the cycles it is possible to anticipate tops and bottoms, as well as, to determine trends. The stock market cycles can be a good opportunity to maximize return on investments.
However, it is not easy to analyze the repetition of typical patterns in stock market performance because often cycles mask themselves; sometimes they overlap to form an abnormal extremum or offset to form a flat period. The presence of multiple cycles of different periods and magnitudes in conjunction with linear and non-linear trends can form a complex pattern of the curve. Evidently, a simple chart analysis has a certain limit in identifying cycles parameters and using them for predicting.
Any predictive method has own limit. The major obstacle in using cycle analysis is a cycle instability. Due to a probabilistic nature of the stock market cycles, the cycles sometimes repeat, sometimes not. In order to avoid excessive confidence and, therefore, losses it is important to remember about a semi-cyclical nature of the stock market. In other words, the prediction based on cycle analysis cannot guarantee 100% accuracy of prediction.
One of the techniques to improve a prediction accuracy is back-testing. It is the process of testing prediction on prior time periods. At the beginning, instead of calculating the prediction for the time period forward, we could simulate the forecast on relevant past data in order to estimate the accuracy of prediction with certain parameters (and then adjust these parameters).
To discover different patterns in the market movement, including cycles, investors use different software tools. One of the tool is Stock Market Predictor SMAP-3. It is able to extract basic cycles of the stock market (indexes, sectors, or well-traded shares). To build an extrapolation, SMAP-3 uses the following two-step approach: (1) applying spectral (time series) analysis to decompose the curve into basic functions, (2) composing these functions beyond the historical data.
As example, the chart below shows S&P-500 forecast for May 17 - June 2, 2010. The calculation has been performed using SMAP-3. The forecast is the following: downtrend may continue until May 21, then a reversal to uptrend until June 02.

Computational details: regular mode (auto); number of line for spectrum analysis - 48; used historical data period - 4 months (from December 17, 2009 to May 14, 2010); back-test deviation - 1.11%; spectrum lines and fitting charts -

In conclusion, the stock market is an alive system - around can be joy or fear but its buy-sell pulse always exists. To discover different patterns in the market movement, including cycles, investors use different software tools. Sometimes, these computer tools are called "stock market software." Also, stock market software tools help investors and traders to research, analyze, and predict the stock market.
Nothing in this piece or blog should be construed as investment advice in any way. Always do your own research or/and consult a qualified investment advisor. It is wise to analyze data from multiple sources and draw your own conclusions based on the soundest principles. Be aware of the risks involved in stock investments
© Alex Shmatov. Published with permission of the copyright owner. Further reproduction strictly prohibited without permission.
One of the market characters is that it has powerful and pretty consistent cycles. Its performance curve can be considered as a sum of the cyclical functions with different periods and amplitudes. Some cycles known by investors for long, for example, four-year presidential cycle or annual and quarterly fiscal reporting cycles. By identifying the cycles it is possible to anticipate tops and bottoms, as well as, to determine trends. The stock market cycles can be a good opportunity to maximize return on investments.
However, it is not easy to analyze the repetition of typical patterns in stock market performance because often cycles mask themselves; sometimes they overlap to form an abnormal extremum or offset to form a flat period. The presence of multiple cycles of different periods and magnitudes in conjunction with linear and non-linear trends can form a complex pattern of the curve. Evidently, a simple chart analysis has a certain limit in identifying cycles parameters and using them for predicting.
Any predictive method has own limit. The major obstacle in using cycle analysis is a cycle instability. Due to a probabilistic nature of the stock market cycles, the cycles sometimes repeat, sometimes not. In order to avoid excessive confidence and, therefore, losses it is important to remember about a semi-cyclical nature of the stock market. In other words, the prediction based on cycle analysis cannot guarantee 100% accuracy of prediction.
One of the techniques to improve a prediction accuracy is back-testing. It is the process of testing prediction on prior time periods. At the beginning, instead of calculating the prediction for the time period forward, we could simulate the forecast on relevant past data in order to estimate the accuracy of prediction with certain parameters (and then adjust these parameters).
To discover different patterns in the market movement, including cycles, investors use different software tools. One of the tool is Stock Market Predictor SMAP-3. It is able to extract basic cycles of the stock market (indexes, sectors, or well-traded shares). To build an extrapolation, SMAP-3 uses the following two-step approach: (1) applying spectral (time series) analysis to decompose the curve into basic functions, (2) composing these functions beyond the historical data.
As example, the chart below shows S&P-500 forecast for May 17 - June 2, 2010. The calculation has been performed using SMAP-3. The forecast is the following: downtrend may continue until May 21, then a reversal to uptrend until June 02.

Computational details: regular mode (auto); number of line for spectrum analysis - 48; used historical data period - 4 months (from December 17, 2009 to May 14, 2010); back-test deviation - 1.11%; spectrum lines and fitting charts -

In conclusion, the stock market is an alive system - around can be joy or fear but its buy-sell pulse always exists. To discover different patterns in the market movement, including cycles, investors use different software tools. Sometimes, these computer tools are called "stock market software." Also, stock market software tools help investors and traders to research, analyze, and predict the stock market.
Nothing in this piece or blog should be construed as investment advice in any way. Always do your own research or/and consult a qualified investment advisor. It is wise to analyze data from multiple sources and draw your own conclusions based on the soundest principles. Be aware of the risks involved in stock investments
© Alex Shmatov. Published with permission of the copyright owner. Further reproduction strictly prohibited without permission.
2010-05-07
Recent Panic Selling Could Be Caused by Computer-generated Plunge
Traders, exchanges, and regulators try to define what prompted Dow Jones Industrial Average near 1,000-point drop on May 6, 2010. One of the theories is that it was a mistake triggered when a trader accidentally sold billions of shares instead of millions. However, it may be not a case this time.
Firstly this correction was supposed to happen as it was predicted by many. Our cycle analysis calculation even predicted the exact date - May 6, 2010 (see our blog post "Contributing Factors in Forecasting: Stocks vs. Stock Market and Sectors"). Secondly it coincides with a bad news from Greece. The last question is why it was so sharp. Could it be a some kind of high-frequency trading effect? Maybe.
A more simple explanation is the following. Buy or sell order executes very fast if meets certain conditions. This is a modern technologies world. There is a very popular loss-protective strategy in stock investing nowadays – to use a stop-loss order if price drops below 8-10%. Now, let's imagine that more and more orders start executing if prices go down and down. It drags major market indexes down. And this is when traders and investors start to panic and post more selling orders. The prices go down reaching 8-10% threshold faster and faster. It becomes like a loop and results an avalanche.
In conclusion, the question is if stock market regulators will be able to prevent such computer-generated plunges. Probably not. Computers, software, the Internet become faster every year. On the other hand, any artificial restrictions can cause stock market liquidity to suffer. Since the liquidity is a very basic thing for free market to function normally, there is no way to avoid such stock market volatility in the future.
© Alex Shmatov. Published with permission of the copyright owner. Further reproduction strictly prohibited without permission.
Firstly this correction was supposed to happen as it was predicted by many. Our cycle analysis calculation even predicted the exact date - May 6, 2010 (see our blog post "Contributing Factors in Forecasting: Stocks vs. Stock Market and Sectors"). Secondly it coincides with a bad news from Greece. The last question is why it was so sharp. Could it be a some kind of high-frequency trading effect? Maybe.
A more simple explanation is the following. Buy or sell order executes very fast if meets certain conditions. This is a modern technologies world. There is a very popular loss-protective strategy in stock investing nowadays – to use a stop-loss order if price drops below 8-10%. Now, let's imagine that more and more orders start executing if prices go down and down. It drags major market indexes down. And this is when traders and investors start to panic and post more selling orders. The prices go down reaching 8-10% threshold faster and faster. It becomes like a loop and results an avalanche.
In conclusion, the question is if stock market regulators will be able to prevent such computer-generated plunges. Probably not. Computers, software, the Internet become faster every year. On the other hand, any artificial restrictions can cause stock market liquidity to suffer. Since the liquidity is a very basic thing for free market to function normally, there is no way to avoid such stock market volatility in the future.
© Alex Shmatov. Published with permission of the copyright owner. Further reproduction strictly prohibited without permission.
2010-05-03
Return on Investment Built on Expectations: Time Factor Is Critical in Stock Investing
Since all stock market buy-sell rush built on expectations, today's prices strongly depend on prices that even expected to be in several months. For example, if you are the first who know that today's $20 share would cost $30 in six months, you would rather to buy immediately. What can happen if others have the same prediction? They can do the same - buy immediately and that buying power can push prices higher very fast. Therefore, the price can jump in a few days due to a perspective of several months.
The chart below shows how short-term price behavior can depend on future expectation. Long-term forecast-1 was positive that pushed price up in short-term. Then when new negative information became available, the long term forecast-2 dragged the price down in short-term.

According to Efficient Markets approach, news and other public information are incorporated into the price of a stock with a certain time delay (price is supposed to reach and keep a stable equilibrium that change only each time a relevant new information is known). Since big money cannot flow very fast, individual investors have some advantage to react quickly. To do this efficiently it is important to watch informational resources, monitor companies' news and macroeconomic trends.
© Alex Shmatov. Published with permission of the copyright owner. Further reproduction strictly prohibited without permission.
The chart below shows how short-term price behavior can depend on future expectation. Long-term forecast-1 was positive that pushed price up in short-term. Then when new negative information became available, the long term forecast-2 dragged the price down in short-term.

According to Efficient Markets approach, news and other public information are incorporated into the price of a stock with a certain time delay (price is supposed to reach and keep a stable equilibrium that change only each time a relevant new information is known). Since big money cannot flow very fast, individual investors have some advantage to react quickly. To do this efficiently it is important to watch informational resources, monitor companies' news and macroeconomic trends.
© Alex Shmatov. Published with permission of the copyright owner. Further reproduction strictly prohibited without permission.
2010-04-23
Contributing Factors in Forecasting: Stocks vs. Stock Market and Sectors
Each company belongs to a particular industry, sector, national stock market, as well as, global stock market. If system conditions change, company and its stocks respond to this changes. Indeed, a general stock market exerts a significant influence on the behavior of an individual company stocks. That is why experienced investors always carefully watch the stock market, sectors, and industries conditions.
On the other hand, a company is a part of subsystems and global system. It means each company performance is a contributing factor in a whole system performance. So that we could analyze a single company and try to predict the behavior of the stock market. However, it is only partially possible. As example, the recent financial crisis caused by a system failure showed that system itself may have a significantly bigger risk-factor.
Since all structure and all levels of sub-structures depend mutually, it would be unwise to ignore either predictions of big, medium, or small parts or a whole system. Evidently it is possible to build a more accurate forecast by combining predictions for system, sub-systems, and elements of sub-system.
As example, let's consider a three-month forecast for stock market (515 stocks from different sectors):

stocks from different sectors:

and individual company stocks from a leading sector:

In conclusion, we could assume that there is a certain probability that the stock market will have a correction (downtrend around 8-12%) after May 6.
The charts have been calculated and plotted by Investment Analyzer Inv-An-4.
© Alex Shmatov. Published with permission of the copyright owner. Further reproduction strictly prohibited without permission.
On the other hand, a company is a part of subsystems and global system. It means each company performance is a contributing factor in a whole system performance. So that we could analyze a single company and try to predict the behavior of the stock market. However, it is only partially possible. As example, the recent financial crisis caused by a system failure showed that system itself may have a significantly bigger risk-factor.
Since all structure and all levels of sub-structures depend mutually, it would be unwise to ignore either predictions of big, medium, or small parts or a whole system. Evidently it is possible to build a more accurate forecast by combining predictions for system, sub-systems, and elements of sub-system.
As example, let's consider a three-month forecast for stock market (515 stocks from different sectors):

stocks from different sectors:

and individual company stocks from a leading sector:
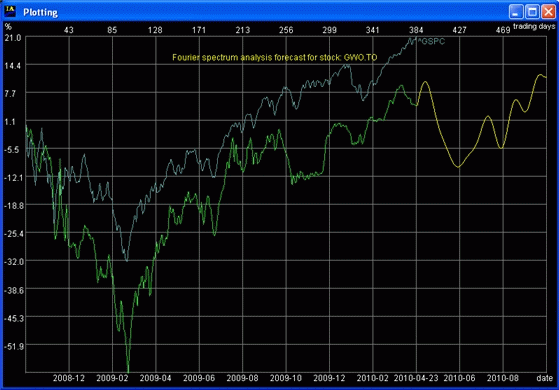
In conclusion, we could assume that there is a certain probability that the stock market will have a correction (downtrend around 8-12%) after May 6.
The charts have been calculated and plotted by Investment Analyzer Inv-An-4.
© Alex Shmatov. Published with permission of the copyright owner. Further reproduction strictly prohibited without permission.
2010-04-17
Predicting Stock Market Using Expert Method
The more methods and information are taken into consideration, the more precise an investment-related solution and, consequently, the more profitable is investing. One of the forecasting methods that uses a collective wisdom is an expert method. This method can be explained by following. As example, an experimentalist shows a pen and asks about 40 people to write down their estimate of the length. Then he collects notes and calculates the average number - normally it is almost 100% accurate. Why it works? Everyone makes errors in different directions so that averaging gives a precise result.
An example of simplified expert method forecast in stock forecasting can be analysts' opinions that collected and averaged. Such information can be found, for instance, on Yahoo Finance webpage "Analyst Opinion" for each stock, it is called "Recommendation Summary". If mean recommendation is equal or close to 1, experts predict strong performance because "1" means "strong buy". If mean recommendation is equal or close to 5, experts predict stock decline because "5" means "sell". It is natural to assume that the more experts express their opinions, the better should be the result of prediction.
Another example of expert forecast could be using your own research of different factors that can contribute certain "opinions" in composed forecast. You can assign different weight for each factor and build an estimation based on weighted averaging. For instance, fundamental analysis may be one the most influential factors, then news factor, technical analysis prediction factor, seasonal price fluctuation factor, etc. All these factors should be added with different weight coefficients. Then the result should be divided by total amount of all weights.
One more idea is to read different current news, analytical articles, blogs, investor forums and draw a summarized conclusion from all opinions, positive and negative predictions. To make this process more automatic, it can be possible to participate on-line polls. There are some websites where you can participate in building a collective forecast for S&P-500 index. You can share your opinion by voting and see the result of composite forecast. If you use more than one method, approach, or tool for prediction, it could be reasonable to give a vote for each one. All participants may benefit from building a simple average forecast. However, do not put too much trust in any method alone - make your own conclusion.
Link to: useful resources
© Alex Shmatov. Published with permission of the copyright owner. Further reproduction strictly prohibited without permission.
Subscribe to:
Posts (Atom)

 Posts
Posts


