New Software Stock Market Tools SMT1:

discover the power of AI Stock Market forecast and trading simulation
- increase your trading profitability
Showing posts with label stock market forecast. Show all posts

2018-09-22

Addaptron Software Release New Stock Market Software SMT1

Addaptron Software announced a software release, SMT1 (Stock Market Tools, release 1), a new advanced software system for End-Of-Day (EOD) traders. One of new advantages is all-in-one output forecast signal. This signal (number) is the result of processing data by Artificial Intelligence (AI) Forecast Module. The set of data consists of technical indicators, waves prediction, pattern filter, and cycles extrapolation. Based on Machine learning results, AI decides how to interpret all relevant data and express the conclusion in a single number.
SMT1 is intended for EOD traders with intermediate or advanced knowledge in the Stock Market and computer software. The software consists of four major functionalities: Forecast, Backtest, Simulation, and Tracking. SMT1 is provided with User’s Manual which helps to understand the general structure of the software, connections between functional modules, and how effectively utilize all features.
The software uses EOD historical prices data as input. SMT1 includes a free Downloader that allows downloading EOD historical quotes files of selected symbols (some of most traded leveraged ETFs) from Addaptron Software server for free. Optionally, users can use own input data files. User’s Manual explains how to use own input files.
The main concept of the software is to work (i.e., predict, simulate and optimize trading performance) with the group of well-traded leveraged ETFs to maximize overall return. Each ETF has inverse counterpart and represents different industries that allows finding a potential winner every day. Although the software is suited to a specific niche, users can try to use own group of symbols.
Stock Market traders use different types of sell signal to exit position. Since exit signal cannot be reliable enough, some traders use stop loss and profit target to exit position. Addaptron Software has done numerous computer simulations to learn if adding more exit conditions can improve trading return. The research discovered that a better trading return in the long run can be achieved by using as many as four conditions for exit. This multi-trigger exit concept has been implemented in SMT1 as a new 4-Way Exit Method. This is another SMT1 advantage.
The software also includes an extra feature to record buy-sell transactions, analyze a current position, recommend the action, and measure trading performance. Since AI is able to optimize many settings parameters, the number of user-defined parameters is minimized so that users can save time.
Downloading and installing SMT1 is a very easy process and explained step-by-step on download page . All retail traders are eligible for free fully-functional version during initial 30-day period.
The example of SMT1 user interface: tab-page Simulation (back testing): 


2015-03-03

SMFT-2 is a New Stock Market Prediction Software

SMFT-2 (Stock Market Forecast Tools) is a new integrated system by Addaptron Software. It is the next generation of the software that intended to replace older SMFT-1 version. As a result of a few recent development projects, the new version is based on new advanced methods, provides more accurate prediction, and is easier to use.

Prediction modules is built with back-test calculation to estimate the accuracy of forecast within the recent performance periods. Additionally, the back-testing computations is important if more than one method is used. It allows estimating the weight of each method in a composed result; the weights that are proportional to the ability of the methods to predict the price.

SMFT-2 currently includes five major modules:

  • TA Predictor - prediction for day or week period based on Technical Analysis, pattern recognition and Neural Networks (generates composite result). Back-analysis models optimization and batch calculation for comparative analysis included.

  • Waves - Elliott Wave model: back-test optimization, up to 10 waves forecast.

  • Cycles - prediction based on cycle analysis.

  • Week day - search for maximum performance using price behavior depending on week day. It allows discovering the best entry/exit days of week; batch calculation included.

  • Month day - search for maximum performance using price behavior depending on month day. It allows discovering the best entry/exit days of month; batch calculation included.


  • The implemented methods are statistically proven and widely used. All modules share the same EOD (end-of-day) input data. The software is provided with a free Downloader that allows downloading EOD historical quotes files from the Internet for free. A fully-functional software SMFT-2 is free during initial 30-day period. The software and associated documentation are delivered via download links over the Internet. For technical requirements, installation instruction, and download link, visit SMFT-2 download page.


    2010-06-27

    Multi-input Improvement of One-day Performance Indicator

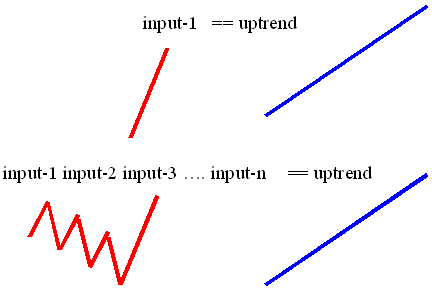
    Stock market forecast can be built using different technical indicators. The relative change between the closing prices of two consequent days can be called one-day performance indicator (ODP indicator). The interpretation of ODP indicator chart is very simple - an uptrend starts after a big positive value of ODP indicator (the chart has been presented in the recent post). It works by a simple scheme: input1 → output.

    However, a closer look at ODP indicator chart reveals also a typical pattern before starting uptrend - it fluctuates while moving down and then it has a big positive value. So that the more informative scheme would be in case of using n days of ODP indicator signals: (input1, input2, . . inputn) → output. It reminds candlesticks pattern chart. A candlestick figure consists of Real Body and Upper and Lower Shadows. The Real Body size is proportional to the difference between opening and closing prices of one day. Since it is no a big difference between closing prices of previous day and opening price of the next day, there is a similarity between Real Body and ODP indicator.


    Considering this uptrend case, it is important to notice that there could be many other ODP indicator patterns. Investors could analyze these multi-day patterns on charts (in the same way as candlesticks pattern is used as a tool to predict future prices) or by using an automatic statistical method to map the correlation (input1, input2, . . inputn) → output. Evidently, one of the simple and powerful statistical methods that could be used for this purpose is Neural Network.

    © Alex Shmatov. Published with permission of the copyright owner. Further reproduction strictly prohibited without permission.