New Software Stock Market Tools SMT1:

discover the power of AI Stock Market forecast and trading simulation
- increase your trading profitability
Showing posts with label technical indicators. Show all posts

2011-05-28

Are Technical Indicators Useful?

Yes and No. Evidently, there are periods when technical analysis works and the periods when it does not. The reasons can be many – fundamental changes, revised expectations, unexpected news, etc. During the periods when a majority of market participants make their decisions based on past market performance, as a rule, there would be some technical indicators that relatively work well.

Are there best ones? During some periods, some indicators might be the best winners, others – the worst losers. But all things are subject to change. Besides, indicators and markets are often a two-way system, i.e., markets can be affected when a huge number of investors use the same indicator(s). For example, the indicator predicts flat 2 days and then an uptrend for 3 days. If everybody follows, the forecast fails because price would be driven up first 2 days by buying volume and then 3 days flat or down-trending due to taking profit.

Other technical methods. In many cases, due to a semi-stochastic nature of the market, probabilistic statistical methods are able to predict well. Some of the systems that employed such methods is Neural Network (NN). NN often suffers from “over-fitting”. It is bad because over-fitting gives an exact but sometimes wrong result more often than an approximate but correct one. Cycle analysis, as another statistical method, has other advantages and disadvantages.

2010-11-13

November 2010: The Stock Market Is Taking Break

The US stock market reached the highest level in two years after a strong two-month rally. However, good news about improving retail results and a four-month low jobless claims rate were unable to push the market higher. Since the current market is driven mostly by news, it was a relatively rare case when technical indicators were able to predict a downtrend. A massive insider selling was another factor that contributed to the decline. If the correction is deep, then a consequent cyclical reaction might send the market up again.

The GDP grew at a 2% pace in the third quarter that is slightly better than the 1.7% growth during the second quarter. The government says that the improvement of GDP-to-deficit ratio is the biggest since fiscal 1987 year. Many analysts expect that the US corporate earnings will aspire higher despite a weakening dollar and a slow-speed recovery will lead eventually to an economic normalization.

2010-10-09

October 2010 Stock Market Overview: Fundamentals Not Improving, Technicals Not Worsening

Due to a growing expectation that the US Federal Reserve will ease a credit environment to help the economy recovery, the US dollar dropped to several-month lows against most foreign currencies. More dollars may stimulate the economical growth. On the other hand, if the Federal Reserve pumps more dollars into the economy, a falling dollar can negatively affect consumers, businesses, and investors.

A dollar weakness together with the news that the US federal deficit for the 2010 budget year was estimated around $1.3 trillion add some fear of the instability of the system, Gold hit a new high that may also evidence a weak hope among investors for a decent stock market performance.

The US unemployment stayed at high 9.6% rate for the last couple of months. Adding jobless people who are not actively seeking work and people who are underemployed result more than 17%. Such statistics may indicate that the stimulus measures failed to create jobs as it was initially expected.

Some of technical indicators signal a lasting momentum that may keep the recent uptrend cycle for several weeks ahead. However, the third quarter earnings reports may not be so optimistic to sustain an existing stock market evaluation. In this case, major stock market indexes may have a correction if more negative news add the pressure.


The chart above shows S&P-500 forecast for the period from October 11 to October 22, 2010. The calculation has been performed using Neural Network Stock Trend Predictor NNSTP-2. The forecast is a slight uptrend.

2010-08-27

S&P-500 Forecast for the First 10 Days of September on the Basis of Technical Indicators Signals

There is a lot of technical indicators, as well as, multiple interpretations of each indicator's signal. Many stock investors and traders use own favorite indicators and insist on specific interpretations. How to make sure that it is right? What if to allow a computer to decide using back-testing which indicator should be trusted more at current market conditions?

One of computer tools that enables to compose the price forecast with weights accordingly to predictive ability of each technical indicator is Investment Analyzer InvAn-4. It performs a short-term (10 trading days) forecast using Neural Network. The chart below shows an example of such forecast. It is S&P-500 index forecast for the first 10 days of September, 2010


It indicates that the index may rise until September 3 and then follow some downtrend.


Nothing in this piece or blog should be construed as investment advice in any way. Always do your own research or/and consult a qualified investment advisor. It is wise to analyze data from multiple sources and draw your own conclusions based on the soundest principles. Be aware of the risks involved in stock investments

2010-06-27

Multi-input Improvement of One-day Performance Indicator

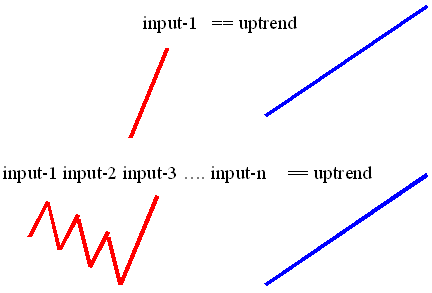
Stock market forecast can be built using different technical indicators. The relative change between the closing prices of two consequent days can be called one-day performance indicator (ODP indicator). The interpretation of ODP indicator chart is very simple - an uptrend starts after a big positive value of ODP indicator (the chart has been presented in the recent post). It works by a simple scheme: input1 → output.

However, a closer look at ODP indicator chart reveals also a typical pattern before starting uptrend - it fluctuates while moving down and then it has a big positive value. So that the more informative scheme would be in case of using n days of ODP indicator signals: (input1, input2, . . inputn) → output. It reminds candlesticks pattern chart. A candlestick figure consists of Real Body and Upper and Lower Shadows. The Real Body size is proportional to the difference between opening and closing prices of one day. Since it is no a big difference between closing prices of previous day and opening price of the next day, there is a similarity between Real Body and ODP indicator.


Considering this uptrend case, it is important to notice that there could be many other ODP indicator patterns. Investors could analyze these multi-day patterns on charts (in the same way as candlesticks pattern is used as a tool to predict future prices) or by using an automatic statistical method to map the correlation (input1, input2, . . inputn) → output. Evidently, one of the simple and powerful statistical methods that could be used for this purpose is Neural Network.

© Alex Shmatov. Published with permission of the copyright owner. Further reproduction strictly prohibited without permission.