New Software Stock Market Tools SMT1:

discover the power of AI Stock Market forecast and trading simulation
- increase your trading profitability

2010-08-27

S&P-500 Forecast for the First 10 Days of September on the Basis of Technical Indicators Signals

There is a lot of technical indicators, as well as, multiple interpretations of each indicator's signal. Many stock investors and traders use own favorite indicators and insist on specific interpretations. How to make sure that it is right? What if to allow a computer to decide using back-testing which indicator should be trusted more at current market conditions?

One of computer tools that enables to compose the price forecast with weights accordingly to predictive ability of each technical indicator is Investment Analyzer InvAn-4. It performs a short-term (10 trading days) forecast using Neural Network. The chart below shows an example of such forecast. It is S&P-500 index forecast for the first 10 days of September, 2010


It indicates that the index may rise until September 3 and then follow some downtrend.


Nothing in this piece or blog should be construed as investment advice in any way. Always do your own research or/and consult a qualified investment advisor. It is wise to analyze data from multiple sources and draw your own conclusions based on the soundest principles. Be aware of the risks involved in stock investments

2010-08-09

S&P-500 Index May Drop Soon

There are several negative fundamental factors that can cause stock market downtrend: GDP growth slowed to 2.4% in the second quarter compared with 3.7% in the first quarter; jobless rate is at high level (9.5%); individuals and companies save cash at near record levels; consumer spending shows no signs of picking up; state budget deficit poses an additional risk to the US economy.

Despite a weak current conditions of the US economy and pessimistic investors' expectations, the stock market would continue to move sideways above some supportive level. However, technically S&P-500 Index is ready to start a downtrend cycle. The probability may increase with approaching September-October traditional low performance season.

Additionally, there is a natural stock market fluctuation. The following chart represents S&P-500 forecast for September 2010 using cycle analysis. The calculation has been performed using SMAP-3 computer program:


A possible prediction is a cycle with minimum in September. However, as always - technical prediction may be different if something fundamental happens.

Nothing in this piece or blog should be construed as investment advice in any way. Always do your own research or/and consult a qualified investment advisor. It is wise to analyze data from multiple sources and draw your own conclusions based on the soundest principles. Be aware of the risks involved in stock investments


2010-07-26

Downloading Data for Investment Analyzer InvAn-3/4

Investment Analyzer InvAn-3/4 uses free data sources to update stock prices and financial data for technical and fundamental analyses. In some rare cases, it can be difficult to download the data from the Internet. The reasons can be different - an interrupting or slow Internet connection, unstable availability of the source, or the absence of requested data (for example, some company can go out of business and its data may be erased from databases).

Despite the fact that InvAn-3/4 built with the optimization to process such kind of errors, in some critical situations, for example, after several attempts to read the fundamental (financial) data with no success, the following error message can appear in a pop-up window:


The solution for this problem is the following:

  1. Click "Continue" to close the pop-up window and then click "Save".
  2. Since it stops on a particular symbol (company), check if this symbol name still exists by visiting Yahoo! Finance or Google. If data are not available anymore, consider deleting the problematic symbol record.
  3. If company data are available, you may try to download data again starting from the number where it stopped using button "From - To" at the bottom of the form (in our example above, go to two boxes besides the button "From - To" and enter in boxes numbers 379 and 525).
  4. If company data are unavailable, try to download data again starting from the number after where it stopped using button "From - To" at the bottom of the form (in our example above, go to two boxes besides the button "From - To" and enter in boxes numbers 380 and 525). Later consider deleting the symbol record.
  5. If two above steps were unsuccessful, check the Internet connection or try to download later.

2010-07-09

Stock Market Ups and Downs for the Next Three Months

S&P-500 has increased around 5% during the first decade of July. Evidently, the stock market was uplifted by investors' optimism. One of the most important fundamental factors that causes this uptrend was strong second-quarter earnings reports. Also other positive news factors stopped sliding down S&P-500 index.

From the technical point of view, downs and ups follow each other. Any action normally results a reaction. To discover periods and amplitudes of this natural market fluctuations, some investors use a cycle analysis. The cycle analysis also can be used to predict the further fluctuations. The following chart represents S&P-500 forecast for August-September-October, 2010. The calculation has been performed using Stock Market Predictor SMAP-3.


Possible prediction from the current 1078 value of S&P-500 is the following. It can increase in about 3-5% in the middle of August and then decrease below 1000 level in September. Then it can reverse to an uptrend again. However, as always - such technical prediction may change if something fundamental happens.

Nothing in this piece or blog should be construed as investment advice in any way. Always do your own research or/and consult a qualified investment advisor. It is wise to analyze data from multiple sources and draw your own conclusions based on the soundest principles. Be aware of the risks involved in stock investments


2010-06-27

Multi-input Improvement of One-day Performance Indicator

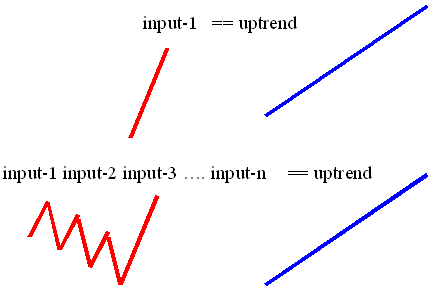
Stock market forecast can be built using different technical indicators. The relative change between the closing prices of two consequent days can be called one-day performance indicator (ODP indicator). The interpretation of ODP indicator chart is very simple - an uptrend starts after a big positive value of ODP indicator (the chart has been presented in the recent post). It works by a simple scheme: input1 → output.

However, a closer look at ODP indicator chart reveals also a typical pattern before starting uptrend - it fluctuates while moving down and then it has a big positive value. So that the more informative scheme would be in case of using n days of ODP indicator signals: (input1, input2, . . inputn) → output. It reminds candlesticks pattern chart. A candlestick figure consists of Real Body and Upper and Lower Shadows. The Real Body size is proportional to the difference between opening and closing prices of one day. Since it is no a big difference between closing prices of previous day and opening price of the next day, there is a similarity between Real Body and ODP indicator.


Considering this uptrend case, it is important to notice that there could be many other ODP indicator patterns. Investors could analyze these multi-day patterns on charts (in the same way as candlesticks pattern is used as a tool to predict future prices) or by using an automatic statistical method to map the correlation (input1, input2, . . inputn) → output. Evidently, one of the simple and powerful statistical methods that could be used for this purpose is Neural Network.

© Alex Shmatov. Published with permission of the copyright owner. Further reproduction strictly prohibited without permission.


2010-06-09

One-day Stock Market Performance Can Be an Indicator

According to Efficient Markets approach, news and other publicly available information are incorporated into the price of a stock. One of the available news factors is a state of the stock market itself - bullish, bearish, or neutral. The state can be the same or it can evolve. A state change results the re-evaluation of price with a certain time delay. So any stock market movement causes a certain reaction of investors. If the market suddenly plunges, investors may start panicking, selling, and dragging the market even faster. If stock market prices are increasing without fluctuations for long, investors become confident to invest. As a result, if more money inflows, demand pushes prices up.

In the same way, one-day stock market performance can impact the emotions of investors. Therefore, it can be considered as a kind of indicator. The chart below shows how a big one-day positive performance can push the market up (callout 1..5):


The chart represents the curve of S&P-500 index values for period from October 2008 to April 2009 (blue line) and the curve of one-day performance (red line). The performance calculated using formula:


P1 = 100% * (C2 - C1) / C1


where C2 - current day closing price, C1 - previous day closing price.

© Alex Shmatov. Published with permission of the copyright owner. Further reproduction strictly prohibited without permission.


2010-05-24

Informational Resources Available

The Research and Development web-page on Addaptron Software website has been updated. The page has been enriched by the latest headlines form different stock investing blogs. It still includes the links to stock investing articles (some articles can be useful for investors-beginners):  
* How to Become a Successful Investor 
* How to Understand the Stock Market Nowadays 
* Optimal Investing Timing  
* Predicting Stock Market Using Expert Method